GETTING STARTED!
TIME TRACKER IN THE RIBBON
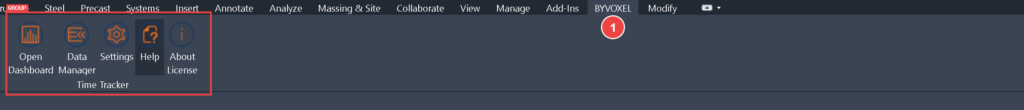
1. Time Tracker Panel:
The Time Tracker panel is located under the ‘BYVOXEL’ tab on the Revit Ribbon. This serve as the primary entry point to launch the application and access all its features.
Quick-access commands under the Time Tracker Group:
Dashboard: Opens the main analytics and time tracking interface.
Data Manager: Launches the database management window to configure clients, hourly rates, and clean up stored projects.
- Settings: Access the add-in tracking configurations, inactivity thresholds, and data backup tools.
Help (?): Direct link to online documentation and user guides.
About: Displays the current application version, your device ID, and your premium license activation status via Lemon Squeezy.
DASHBOARD
OVERVIEW
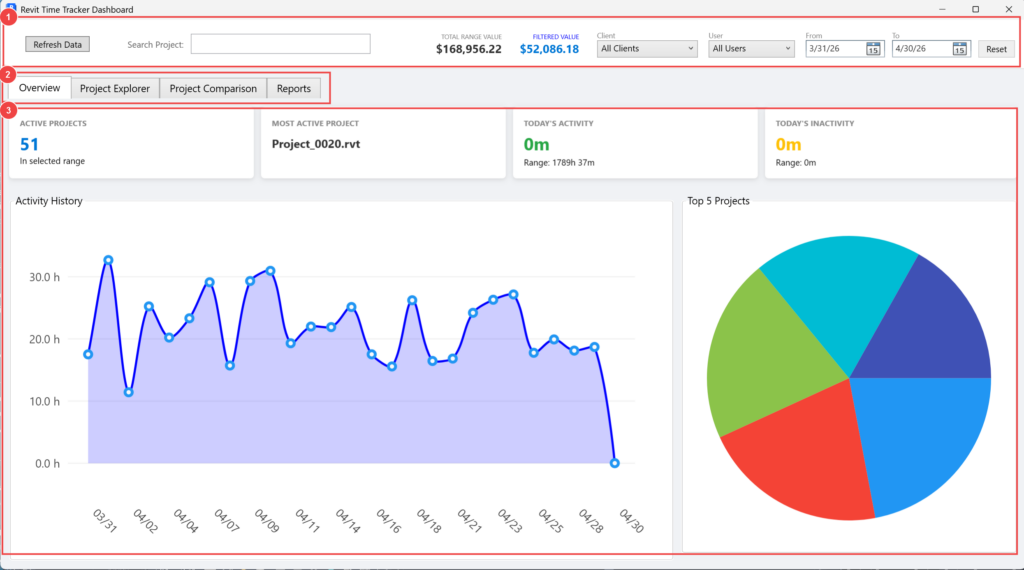
The Overview section serves as the main analytics center for your tracked data. It provides a quick, consolidated summary of your time, financial metrics, and overall performance.
1. Top Control Bar:
Refresh Data: Forces a reload and recalculation of all tracking data, ensuring your dashboard reflects the most recent logs and time entries.
Search Project: A quick text filter to isolate specific Revit projects or records across the dashboard.
2. Module Navigation:
Use these tabs to seamlessly switch between the core functionalities of the Dashboard window: Overview (currently active), Project Explorer, Project Comparison, and Reports.
3. Analytics & Summary Panel:
Active Projects & Most Active Project: Displays the total number of projects worked on during the selected period, highlighting the specific project with the highest tracked time.
Financial Summaries: Shows the Total Range Value and the Filtered Value, calculated automatically by multiplying your tracked hours by the hourly rates assigned to each project or user.
Activity Charts: The Activity History line chart tracks your daily active hours, while the Top 5 Projects pie chart gives a percentage breakdown of where your time is being invested.
Filter Controls: Refine all the visible data in this section using the dropdowns for Client and User, or by setting a specific From / To date range.
PROJECT EXPLORER
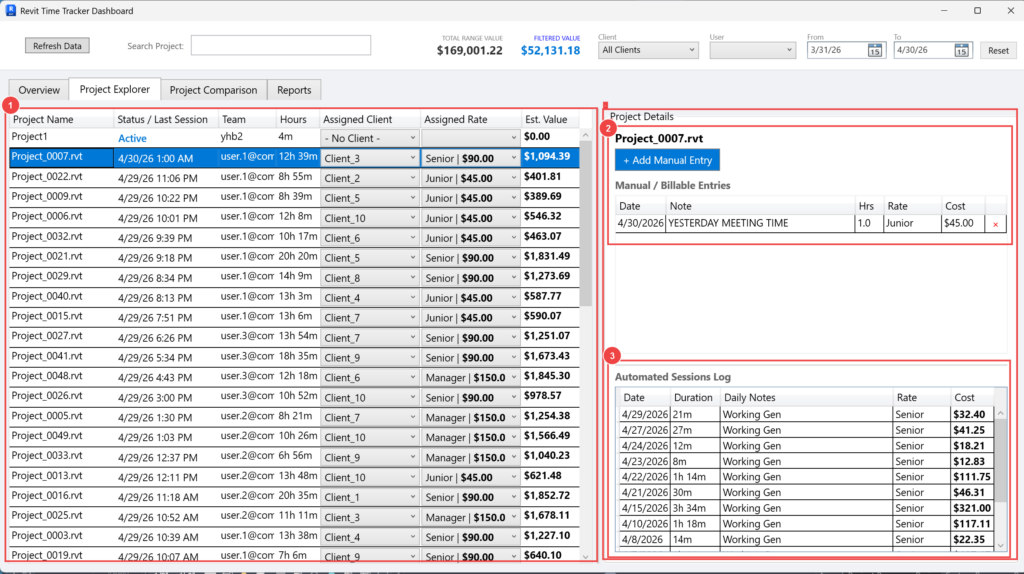
1. Project Summary List:
This primary table provides a comprehensive overview of all your tracked models. It displays key information such as the Project Name, the Status / Last Session date, the user or Team member, total accumulated Hours, the Assigned Client, the Assigned Rate (e.g., Junior, Senior, Manager), and the total Est. Value. Selecting any project from this list will immediately populate its specific data in the detail panels on the right.
2. Project Details & Manual Entries:
This top right section displays the name of the currently selected project and gives you the ability to log additional time not captured automatically by using the + Add Manual Entry button (useful for meetings, site visits, or external tasks).
The Manual / Billable Entries table lists all custom logs added by the user, including the date, explanatory notes, hours spent, applied billing rate, and the resulting cost.
3. Automated Sessions Log:
This bottom right table provides a detailed, day-by-day breakdown of the time automatically tracked by the add-in while you actively worked on the selected model in Revit. It lists the exact date, the total active Duration of the session, any daily notes, the applied Rate, and the resulting Cost.
PROJECT COMPARISON
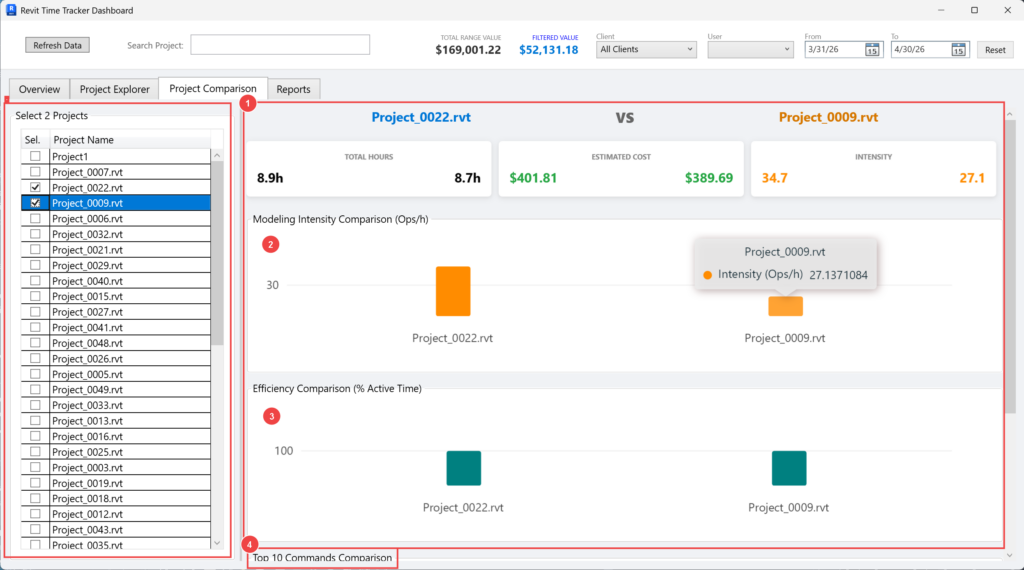
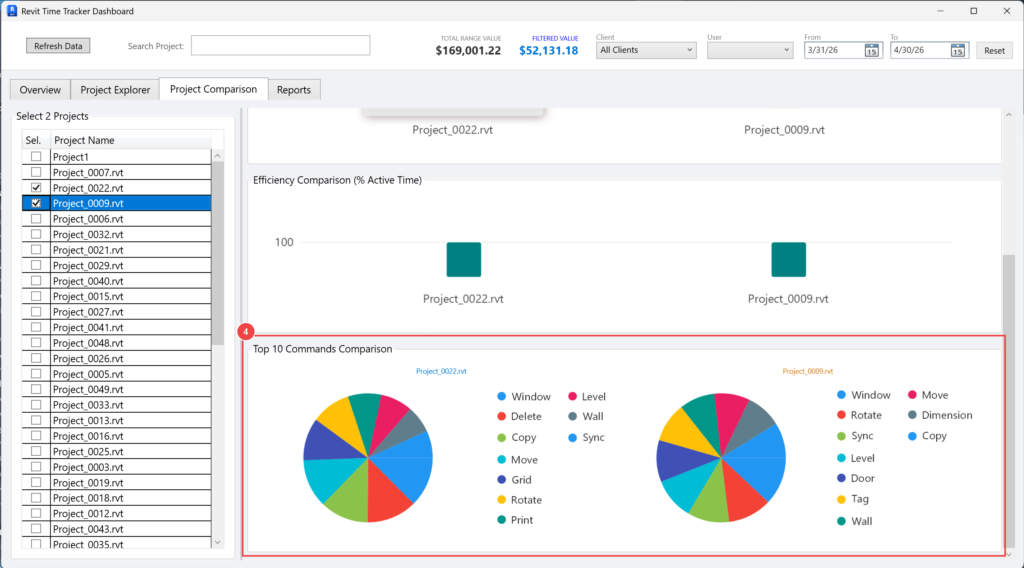
The Project Comparison tab is a powerful analytical tool designed to help you benchmark two different Revit models against each other. It provides visual insights into your team’s workflow, pace, and tool usage.
1. Project Selection & Summary Panel:
To begin a comparison, use the list on the left to check exactly two projects. Once selected, the top panel instantly calculates and displays a side-by-side comparison of their Total Hours and Estimated Cost. You can also use the top right controls to filter this comparison by specific clients, users, or date ranges.
2. Modeling Intensity Comparison (Ops/h):
This bar chart visualizes the work pace by measuring “Operations per Hour.” It provides a clear, quantitative look at how actively users are interacting with the model, helping you understand the intensity of the modeling phase for each project.
3. Efficiency Comparison (% Active Time):
This metric evaluates overall productivity. The chart compares the percentage of true active working time against the time the project was left open but idle, giving you a better understanding of focused working sessions.
4. Top 10 Commands Comparison:
A side-by-side breakdown of the most frequently executed Revit tools (such as Sync, Wall, Window, Copy, or Move) for both projects. This helps you identify the primary nature of the work being performed in each file—for instance, whether a project is in a heavy 3D modeling stage or focused primarily on documentation and detailing.
REPORTS
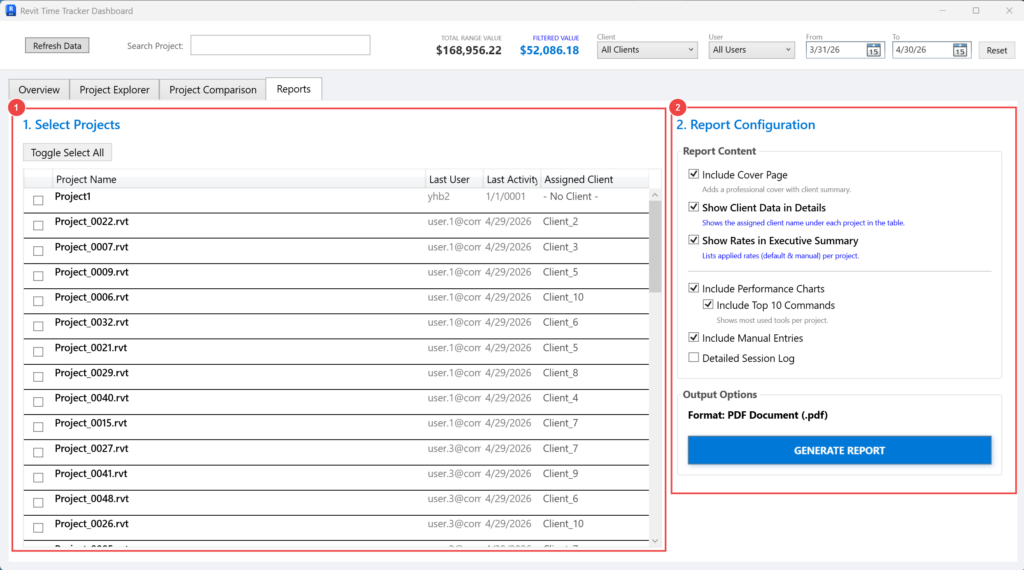
The Reports tab allows you to generate professional, easy-to-read PDF summaries of your tracked time, financial metrics, and project performance based on the filters you have applied.
1. Select Projects:
This section displays a list of all projects that currently match your global Dashboard filters (Client, User, and Date Range).
Use the checkboxes next to each project to choose exactly which ones you want to include in your final export. You can also use the Toggle Select All button to quickly check or uncheck the entire list to save time.
2. Report Configuration & Generation:
Customize the level of detail and the visual elements included in your final document by checking the desired options:
Include Cover Page: Adds a professional title page featuring a clean client summary.
Show Client Data in Details: Displays the assigned client name under each project within the detailed tables.
Show Rates in Executive Summary: Lists the specific billing rates (default and manual) applied to each project.
Include Performance Charts: Embeds visual graphs detailing efficiency and modeling intensity directly into the report.
Include Top 10 Commands: Appends a breakdown of the most frequently used Revit tools for the selected projects.
Include Manual Entries & Detailed Session Log: Attaches a comprehensive, day-by-day breakdown of all your automated tracking sessions and custom manual logs.
Generate Report: Once your content is configured to your liking, click this button to create and save your final PDF document to your local computer.
DATA MANAGER
CLIENTS
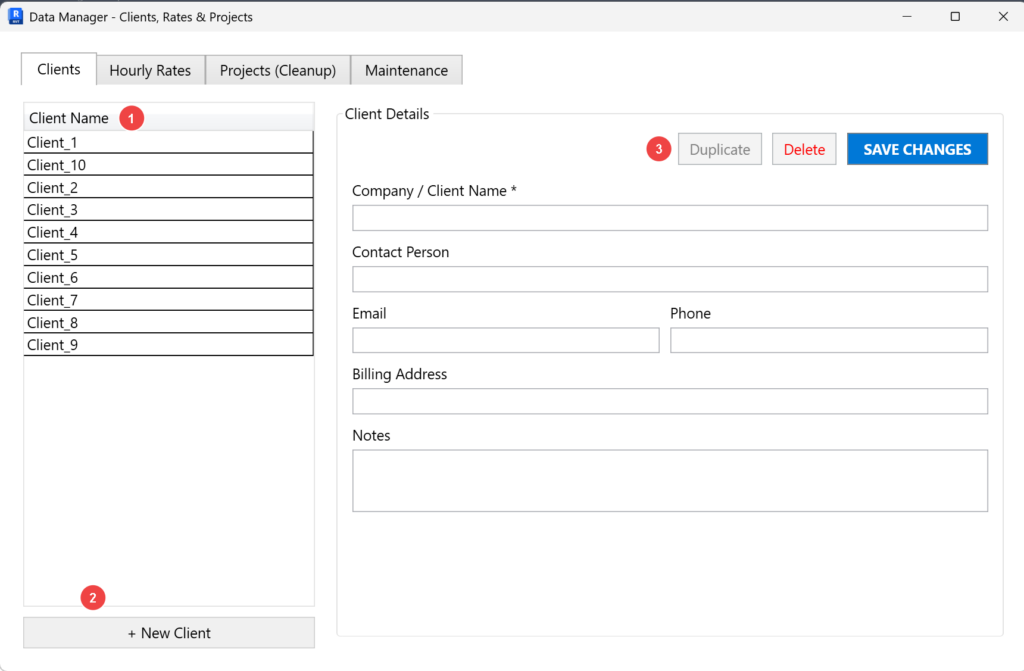
The Data Manager is the central hub for configuring the core information used throughout the application. The Clients tab allows you to maintain a detailed directory of the people or companies you work for.
1. Client List:
Displays a complete list of all currently saved clients. Selecting any name from this list will immediately load their information into the editing panel on the right.
2. + Add New Client Button:
Click the + New Client button to clear the current details form and prepare the fields for a new entry. Once you have filled in the required Company/Client Name and optional contact info, remember to click Save Changes to add the new profile to your records.
3. Management Actions:
- Save Changes: Confirms and applies any edits or newly created profiles to your records.
Duplicate / Delete: Quickly clone an existing client to save time on data entry, or permanently remove a client profile that is no longer needed.
- Important Update Behavior: > If you select an existing client from the list, modify their details, and click Save Changes, the updates will be applied globally across your entire database. All tracked Revit projects currently assigned to this client will automatically reflect the newly updated information.
HOURLY RATES
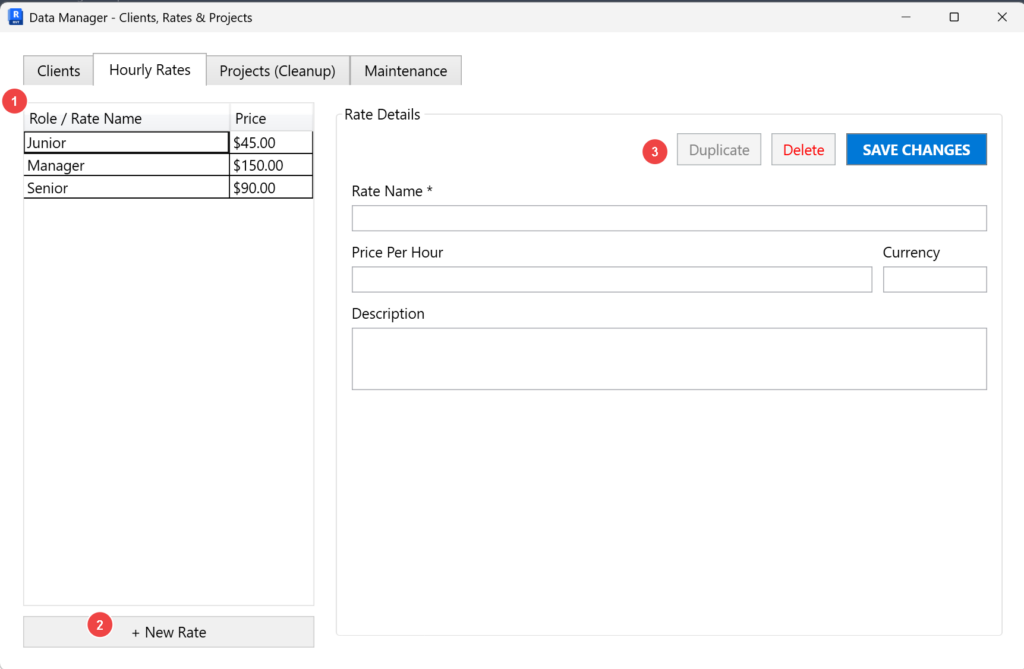
The Hourly Rates tab allows you to define and manage custom billing roles and their associated costs. These rates are essential for automatically calculating the financial value of your tracked time across all your projects.
1. Rates List:
Displays all your active billing roles (e.g., Junior, Senior, Manager) alongside their assigned hourly price. Selecting any rate from this list will load its details into the configuration panel on the right for review or editing.
2. Rate Details & Creation:
Click the + New Rate button to clear the current form and establish a new billing profile. In the details panel, you can define the Rate Name and its Price Per Hour. You also have the option to add a custom Description and specify the Currency to keep your financial reports accurate and organized.
3. Management Actions:
Use the controls at the bottom of the panel to Save Changes applied to a new or existing rate. You can also Duplicate a selected rate to quickly set up a similar profile without typing everything again, or use Delete to permanently remove a rate that is no longer needed in your workflow.
- Important Update Behavior: > Selecting an existing rate from the list, modifying its price or details, and clicking Save Changes will update this specific rate globally. Please be aware that the Est. Value and financial costs for all projects and sessions utilizing this assigned rate will be automatically recalculated based on the new price. If you need a new price for a specific project without affecting previous ones, it is recommended to create a + New Rate instead.
PROJECT CLEAN-UP
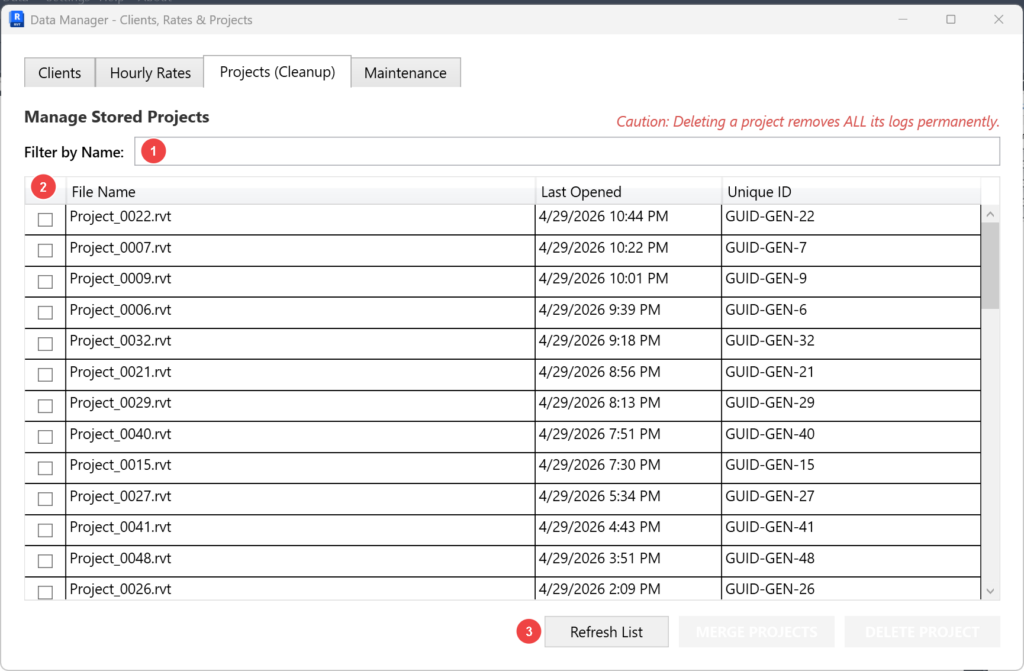
The Projects (Cleanup) tab gives you control over your stored project data. It allows you to view which models have been tracked, consolidate fragmented data, and safely remove old or irrelevant project files to keep your records organized.
1. Filter by Name:
Use this search bar to quickly type and locate a specific Revit project within your tracking history.
2. Managed Projects List:
This table displays all the Revit files currently stored by the tracker. It outlines the File Name, the exact date and time it was Last Opened, and a Unique ID assigned to each project to ensure files are accurately separated, even if they share the same name.
3. Management & Cleanup Actions:
Refresh List: Updates the table to ensure you are viewing the most current list of stored projects.
Merge: A powerful tool for data consolidation. It allows you to combine the tracking data of multiple instances of the same project into a single unified log. To protect your data, the application strictly requires that all selected projects share the exact same File Name. This is incredibly useful for cleaning up fragmented data caused by “cloned” files, detached models, or central model recreations where Revit perceives a new file, but you continue working under the same project name. Merging safely transfers all tracked hours and manual logs into the most recent instance.
Merging is an irreversible action. Ensure you are consolidating the correct files, as the source project ID will be permanently merged into the destination ID in the database. We highly recommend performing a manual backup in the Settings window before proceeding with large data consolidations.
Delete: Remove a specific project. Caution: Deleting a project permanently removes all of its automated logs and manual time entries. This tool is highly useful for cleaning up temporary test files or completed projects that no longer require tracking.
MAINTENANCE
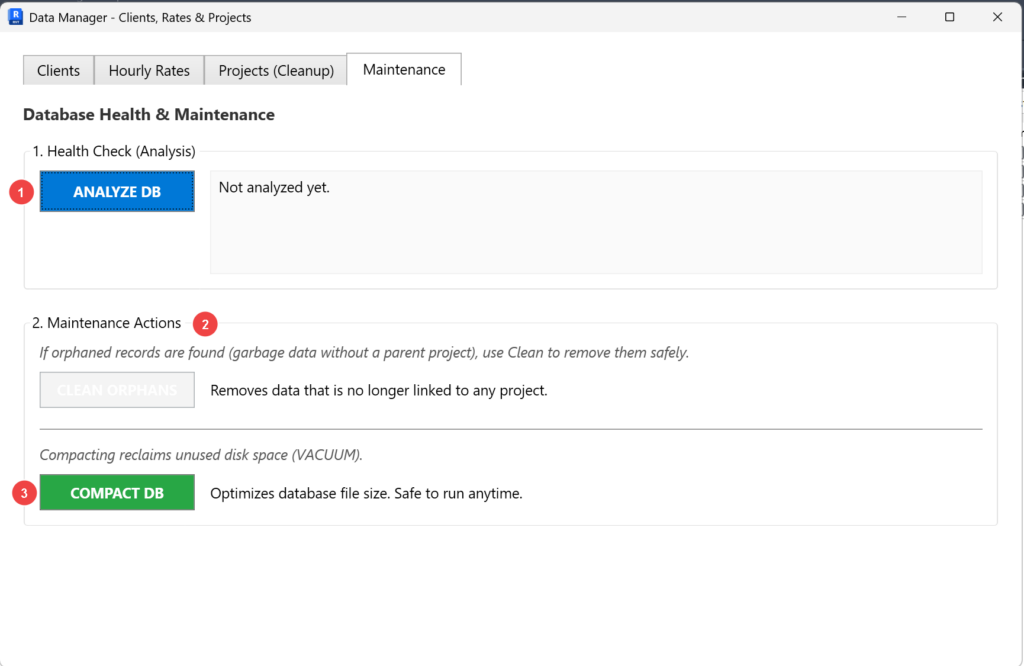
The Maintenance tab provides essential tools to keep your tracking history healthy, fast, and optimized over time.
1. Health Check (Analysis):
Click the Analyze DB button to safely scan your tracking history for inconsistencies, such as “orphaned” records. Orphaned records are fragments of time or command logs that were left behind (usually if a project was improperly removed or if a system crash occurred). The results panel will instantly tell you if your database is healthy or if it requires attention.
2. Clean DB:
If the Health Check detects orphaned records (garbage data without a parent project), the Clean DB button will become available. Use this tool to safely delete those unlinked entries. This ensures your dashboard and reports remain 100% accurate and free of ghost data.
3. Compact DB:
As you delete old projects or clean orphaned records, invisible empty space can be left behind within the tracker’s file storage. The Compact DB action reclaims this unused disk space and optimizes the overall file size. It is a completely safe operation that you can run at any time to keep the add-in running at peak performance.
SETTINGS. PREFERENCES AND DATA MANAGEMENT
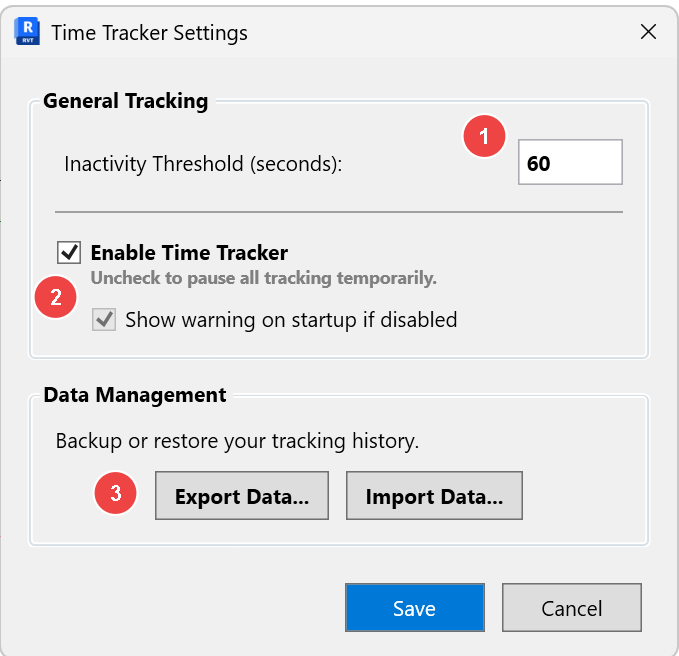
The Settings window allows you to customize how the tracker behaves in the background and provides essential tools to back up your information.
1. Inactivity Threshold (seconds):
This setting defines exactly how much time must pass without any activity (no clicks or typing in Revit) before the add-in marks you as “Idle.” By default, it is set to 60 seconds. This smart detection ensures your project hours are accurate and not artificially inflated if you step away from your desk or take a call.
How the smart tracking works:
Retroactive Deduction: Once your threshold limit is reached, the tracker retroactively deducts those seconds from your active time. This ensures your billable hours are mathematically accurate to the exact second you stopped moving the mouse.
What happens when Revit loses focus? If you minimize Revit or click on another application (like a web browser, Excel, or your email), the tracker will pause immediately, completely ignoring your threshold setting. This guarantees that time spent on other tasks isn’t incorrectly billed to your Revit project.
Choosing the right threshold for your workflow:
Strict Tracking (e.g., 60 – 120 seconds): Ideal for strict billing or fast-paced drafting phases. If you stop interacting for just a minute, tracking pauses. (Note: If you frequently spend several minutes analyzing a complex 3D model without clicking, a low threshold might incorrectly pause your time).
Flexible Tracking (e.g., 300 – 600 seconds): Ideal for conceptual design, engineering analysis, or heavy coordination phases. It allows you to think, review complex views, or wait for Revit to process heavy tasks (like printing or rendering) without the timer stopping.
💡 PRO-TIP: The “15-Minute Break” with a 10-Minute Threshold You might wonder: “If I set my threshold to 600 seconds (10 minutes) and step away from my desk for 15 minutes (leaving Revit open), will the tracker record 10 minutes of fake ‘active’ time before it realizes I’m gone?”
The answer is NO. Thanks to the retroactive deduction feature, the moment the tracker hits the 10-minute limit, it “travels back in time” and cuts your active session exactly at the second you stopped moving the mouse. Your timesheet will perfectly reflect 15 minutes of Idle time, and zero minutes of fake work.
💡 IMPORTANT NOTE: Keeping Revit Active
Avoid Leaving Active Transactions: > For the most accurate time tracking, please ensure you complete any active Revit commands (press Escape twice or click “Modify”) before stepping away from your desk. Leaving Revit in the middle of a command or with an open transaction can block the background monitoring engine, which may result in a slight delay or inaccurate closing of your work session.
Dashboard Synchronization: When navigating between the Overview and Project Explorer tabs, you may notice a slight difference in figures if a session has just finished. If you observe any discrepancy, simply click the “Refresh” button in the top control bar. This forces the application to re-query the database and synchronize all active calculations across all tabs, ensuring your data is perfectly aligned.
2. Enable Time Tracker:
This master switch allows you to pause all background tracking temporarily. This is useful if you are doing personal tests or training exercises in Revit and do not want those hours logged into your official project history.
Show warning on startup if disabled: If checked, the add-in will display a gentle reminder when you open Revit, letting you know that tracking is currently paused. This ensures you never accidentally work on a billable project without recording your time.
3. Data Management (Backup & Restore):
Export Data: Creates a secure, compressed backup file of your entire tracking history, including clients, rates, and all project logs. We highly recommend using this feature regularly to keep your data safe.
Import Data: Allows you to restore a previously exported backup file. This is particularly useful if you are moving to a new computer or need to recover your records after a system reinstall.
ABOUT WINDOW. VERSION, SEND BUGS AND LICENSING INFO.
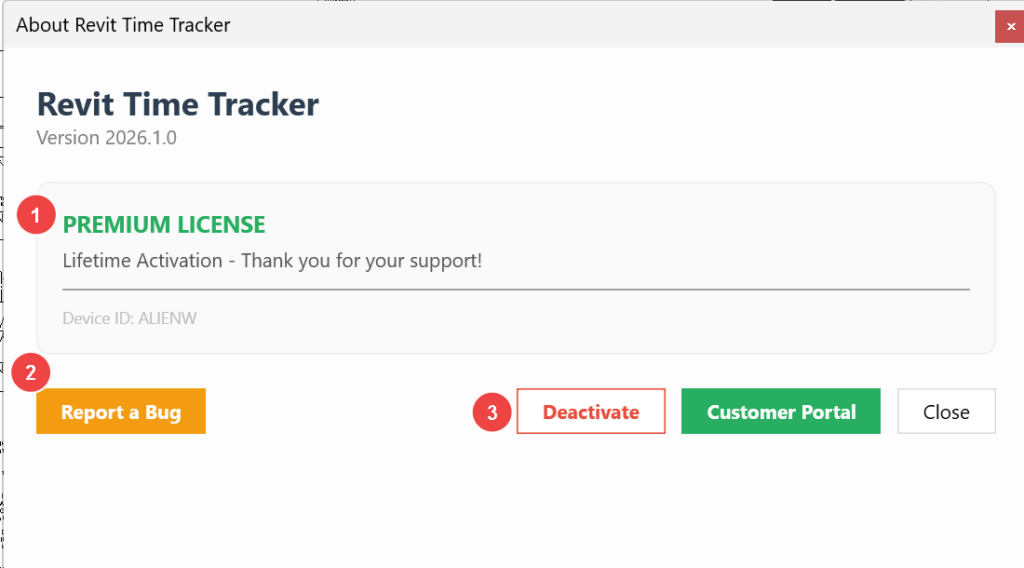
The “About” window provides essential details regarding your current installation, software version and license status.
1. License Status:
Indicates your current operational state, which can be Trial, Activated License, or Expired Trial. It also displays your unique Device ID associated with your computer.
2. Report a Bug / Export Diagnostic Logs
Clicking the “Report a Bug” button will securely collect your latest Revit Time Tracker log along with your most recent Revit Journal file. These files contain crucial diagnostic information.
For your convenience, the app will automatically compress them into a .zip file and place them in a dedicated folder named “Revit Time Tracker Logs” directly on your Desktop. You can then easily attach this .zip file to an email when contacting support.
3. License related bottoms
Deactivate: Allows you to securely deactivate the license on your current machine so it can be transferred or used on another device (available for Activated Licenses).
Customer Portal: A direct link to manage your subscription, download invoices, or update payment details through the Lemon Squeezy portal.
License Activation Window: If your status is Trial or Expired Trial, a dedicated activation window is accessible for you to enter your license key after purchasing the software. This process validates your purchase, unlocks all premium functionalities, and updates your status to Activated.